
Authors: Juan Lopera;1 Monique Hunter;1 Ray-Yuan Chuang;1Stephen King;1 Megan Amselle;1 Brian Chase;1 Maria Mayda;1 Kevin Zinn;1 Samuel S. Minot;2 Nicholas B. Greenfield;2 Dev Mittar1
1ATCC, Manassas, VA
2One Codex, San Francisco, CA
Introduction
Development of ATCC NGS Standards
Using ATCC NGS Standards to Evaluate PCR Amplification, Library Preparation, and Sequencing
Using ATCC NGS Standards to Evaluate Data Analysis
Combining the ATCC NGS Standards with the Power of One Codex
Conclusion
References
Abstract
ATCC has developed NGS Standards for use in a broad array of applications ranging from method optimization to data interpretation. These standards are fully sequenced, characterized, and authenticated mock microbial communities that mimic mixed metagenomic samples. They were developed as whole cell or nucleic acid preparations with even or staggered genomic DNA abundance, and medium or high levels of mock community complexity ranging from 10 to 20 strains per sample. Here, we explore the development and use of the NGS Standards.
Download a PDF of this application note
Download NowIntroduction
Advancement and accessibility of next-generation sequencing technologies have influenced microbiome analyses in tremendous ways, opening up applications in the areas of clinical, diagnostic, therapeutic, industrial, and environmental research. However, due to the complexity of 16S rRNA and metagenomic sequencing analysis, significant challenges can be posed by biases introduced during sample preparation, DNA extraction, PCR amplification, library preparation, sequencing, or data interpretation. Many researchers have published studies on these biases, and leaders in the microbiome field have highlighted the need for standardization.1-4
One of the primary challenges in assay standardization is the limited availability of reference materials. To address these biases and provide a measure of standardization within microbiome research and applications, ATCC has developed a set of mock microbial communities, which includes lyophilized whole cells or genomic DNA, for use as NGS Standards in microbiome research. These standards mimic mixed metagenomics samples and comprise fully sequenced, characterized strains selected on the basis of select phenotypic and genotypic attributes. To further enhance the use of NGS Standards and eliminate the bias associated with data analysis, One Codex has developed a data analysis module in collaboration with ATCC that provides simple output in the form of true-positive, relative abundance, and false-negative scores for 16S rRNA community profiling and shotgun metagenomic sequencing.
Development of ATCC NGS Standards
ATCC NGS Standards comprise fully sequenced, characterized strains selected on the basis of phenotypic and genotypic attributes, such as cell wall type (Gram stain classification), GC content, genome size, unique cell wall characteristics, and spore formation (Table 1).
These standards were prepared as lyophilized whole cells or genomic DNA and were developed with even or staggered relative abundance and medium or high levels of mock community complexity (10 or 20 strains per sample) (Figure 1).
Table 1. Selection attributes for strains included in ATCC NGS Standards.
| Genus species | ATCC number | Gram status | Genome size (Mb) | % GC | 16S copies | GenBank ID | Special features | Microbiome |
|---|---|---|---|---|---|---|---|---|
| Bacillus cereus | 10987 | Positive | 5.42 | 35.2 | 12 | NC_003909.8 | Endospores former | Soil |
| Bifidobacterium adolescentis | 15703 | Positive | 2.09 | 59.2 | 5 | NC_008618.1 | Anaerobe | Gut |
| Clostridium beijerinckii | 35702 | Positive | 6.49 | 30 | 14 | NC_009617.1 | Spores former | Gut/soil |
| Deinococcus radiodurans | BAA-816 | Negative | 3.29 | 66.7 | 7 | NC_001263.1 | Thick cell wall | Gut/environment |
| Enterococcus faecalis | 47077 | Positive | 3.36 | 37.5 | 4 | NC_017316.1 | Biofilm producer | Gut |
| Escherichia coli | 700926 | Negative | 4.64 | 50.8 | 7 | NC_000913.3 | Facultative anaerobe | Gut |
| Lactobacillus gasseri | 33323 | Positive | 1.89 | 35.3 | 6 | NC_008530.1 | Nuclease producer | Vaginal/gut |
| Rhodobacter sphaeroides | 17029 | Negative | 4.60 | 68.8 | 3 | NZ_AKVW01000001.1 | Metabolically diverse | Aquatic |
| Staphylococcus epidermidis | 12228 | Positive | 2.56 | 31.9 | 5 | NC_004461.1 | Thick cell wall | Skin/mucosa |
| Streptococcus mutans | 700610 | Positive | 2.03 | 36.8 | 5 | NC_004350.2 | Facultative anaerobe | Oral |
| Acinetobacter baumannii | 17978 | Negative | 4.34 | 39 | 6 | NZ_CP009257.1 | Filaments, capsule | Environment |
| Actinomyces odontolyticus | 17982 | Positive | 2.39 | 65.5 | 2 | NZ_DS264586.1 | Type 1 fimbriae | Oral |
| Bacteroides vulgatus | 8482 | Negative | 5.16 | 42.2 | 7 | NC_009614.1 | Anaerobe | Gut |
| Helicobacter pylori | 700392 | Negative | 1.67 | 38.9 | 2 | NC_000915.1 | Helix shaped | Stomach/gut |
| Neisseria meningitidis | BAA-335 | Negative | 2.27 | 51.5 | 4 | NC_003112.2 | Diplococcus | Respiratory tract |
| Porphyromonas gingivalis | 33277 | Negative | 2.35 | 48.4 | 4 | NC_010729.1 | Anaerobe, collagenase | Oral |
| Propionibacterium acnes | 11828a | Positive | 2.56 | 60 | 4 | NC_006085.1 | Aerotolerant anaerobe | Skin |
| Pseudomonas paraeruginosa | 9027b | Negative | 6.26 | 66.6 | 4 | NC_009656.1 | Facultative anaerobe | Skin |
| Staphylococcus aureus | BAA-1556 | Positive | 2.82 | 32.8 | 6 | NC_007795.1 | Thick cell wall | Skin/respiratory |
| Streptococcus agalactiae | BAA-611 | Positive | 2.16 | 35.6 | 7 | NC_004116.1 | Serogroup B | Vaginal/environment |
aFollowing this study, Priopionibacterium acnes has since undergone a taxonomic name change to Cutibacterium acnes.
bFollowing this study, Pseudomonas aeruginosa has since undergone a taxonomic name change to Pseudomonas paraeruginosa.
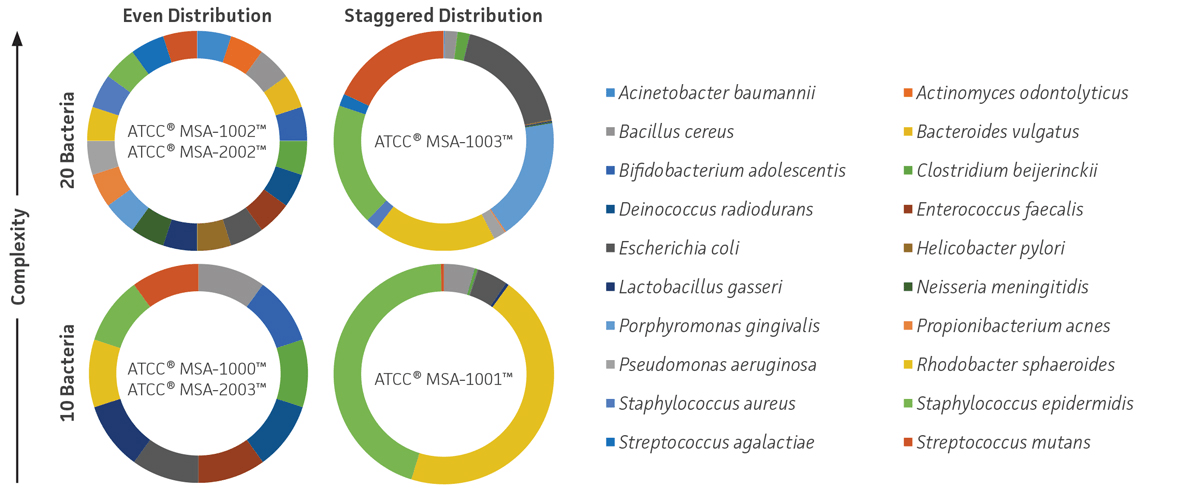
Figure 1. ATCC NGS Standards. ATCC MSA-1000, MSA-1001, MSA-1002, and MSA-1003 are genomic DNA standards, and ATCC MSA-2002 and MSA-2003 are lyophilized whole cell standards.
Using ATCC NGS Standards to evaluate PCR amplification, library preparation, and sequencing
To evaluate factors that contribute to biases associated with PCR amplification, library preparation, and sequencing, we performed an interlaboratory comparison following the earth microbiome protocol, which targets the V4 region for 16S community profiling. The data revealed significant inter-laboratory variability in the number of true positives (70–95%) and false positives (83–100%) as well as in the relative abundances (Figure 2A). We also compared three different regions of the 16S rRNA gene (V1V2, V3V4, and V4) using the genomic DNA NGS Standards. The results revealed that only the V1/V2 region of the 16S rRNA gene was able to profile the bacteria to the species level (true positives = V1V2: 90–100%, V3V4: 90–95%, V4: 90–95%, along with significant differences in the expected verses observed relative abundances) (Figure 2B). Overall, the data clearly reveals the need for reference standards to standardize critical methods used in microbiome analyses.
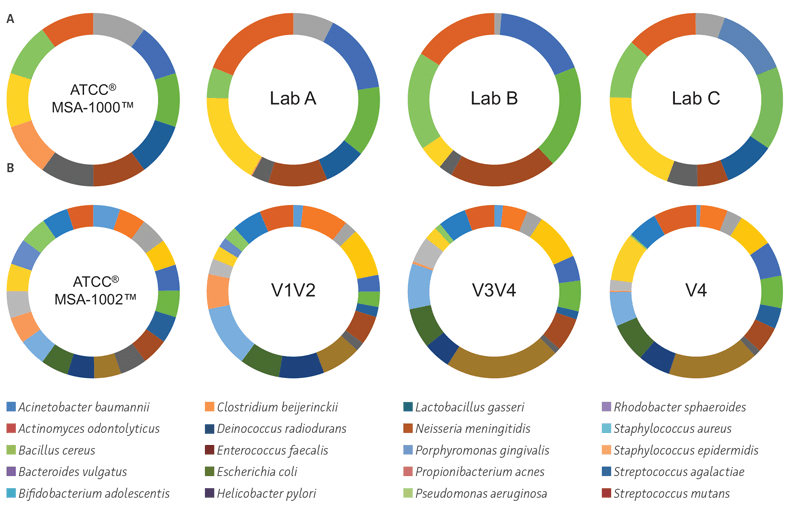
Figure 2. The use of standards during PCR amplification, library preparation, and sequencing. (A) Inter-laboratory variations in identity and relative abundances. 16S rRNA V4 sequence data from different laboratories. Percent ratios of expected and observed organisms in the even genomic mock community comprising 10 organisms (ATCC MSA-1000). The blinded samples were sent to commercial vendors where they used their standard 16S protocol (Earth Microbiome Project) on the Illumina platform. (B) Choice of 16S rRNA primer regions affects identity and relative abundances. 16S rRNA community profiling results from the ATCC MSA-1002 standard using primer sets covering the V3V4, V1V2, and V4 regions on the Illumina platform. The FASTQ files were analyzed using One Codex. For details on how to calculate the true-positive, false-positive, and relative abundance score, visit http://app.onecodex.com/atcc.
Using ATCC NGS Standards to evaluate data analysis
To evaluate biases associated with variations between data analysis platforms, we compared simulated data sets and two laboratory data sets that were produced using the ATCC MSA-1000 genomic DNA standard on the One Codex and NEPHELE5 data analysis platforms (Figure 3). The simulated data were generated by using a next-generation sequencing read simulator (ART)6 and the GenBank ID data and 16S rRNA copy number from each individual bacterial strain (Table 1). Here, all data were generated using primers against the V1/V2 region of the 16S rRNA gene. The results indicate that the One Codex platform identified all bacteria at the species level, while the NEPHELE platform identified bacteria at the genus level with wide variations in the relative abundances.
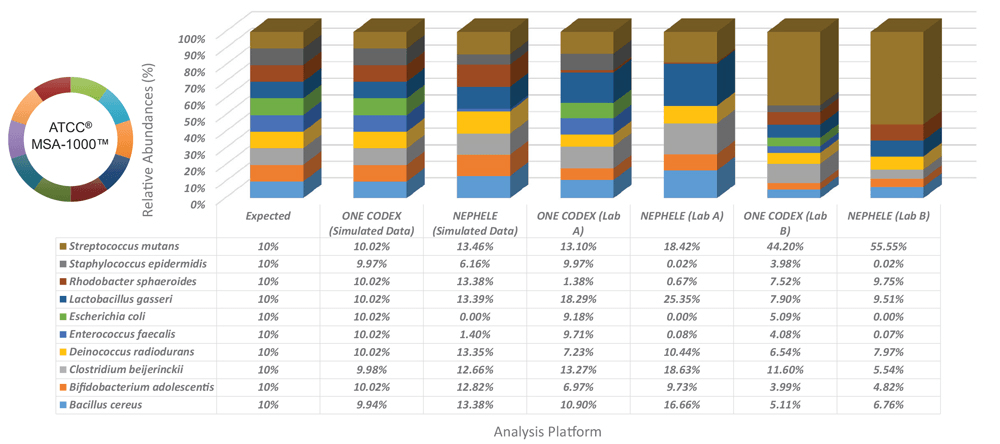
Figure 3. Data analysis platform affects identification and relative abundances. Simulated data sets and two laboratory data sets generated using the ATCC MSA-1000 genomic DNA standard using the 16S rRNA (V1/V2) primer set were evaluated on the One Codex and NEPHELE (https://nephele.niaid.nih.gov) platforms.
Combining the ATCC NGS Standards with the power of One Codex
To further enhance the use of ATCC NGS Standards and eliminate the bias associated with data analysis, we developed a data analysis module in collaboration with One Codex (https://app.onecodex.com/atcc) to provide simple output in the form of true-positive, relative abundance, and false-positive scores for 16S community profiling and shotgun metagenomic sequencing methods. Here, we compared the One Codex data analysis module side-by-side with three other commonly used analysis platforms. The results demonstrated significant variations among the number of true positives, the relative abundances, and the inability to identify all organisms at the species level (Figure 4). In contrast, the One Codex analysis tool, which was specifically customized for the ATCC NGS Standards, generated relative abundances close to the expected ratio.
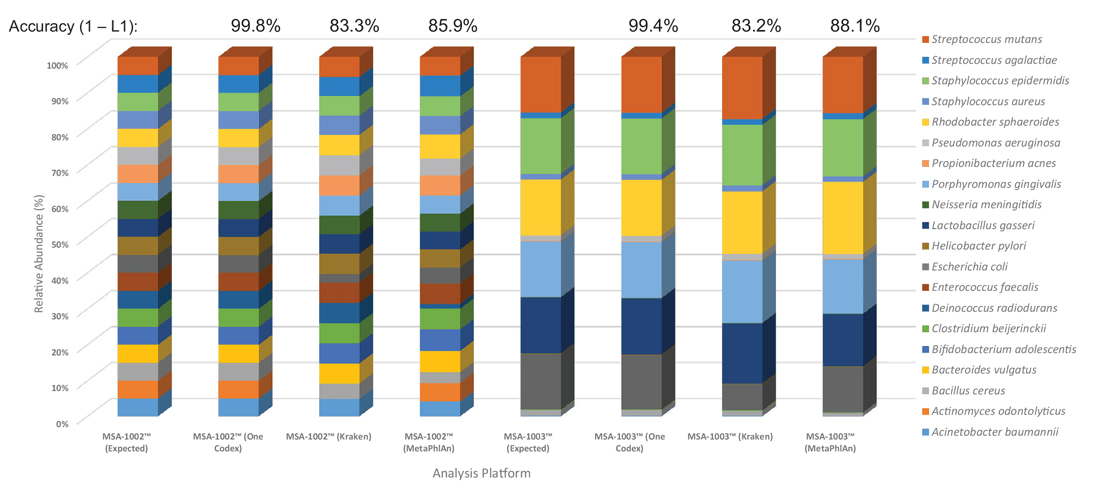
Figure 4. Data analysis platform affects identification and relative abundances. ATCC MSA-1002 and ATCC MSA-1003 were used to compare the performance of the One Codex, Kraken, and MetaPhlAn data analysis platforms. The percentages located above the bars represent the overall accuracy between platforms, as compared using L1-distance. Only One Codex demonstrated the accuracy necessary to robustly quantify microbiome sequencing errors.
Conclusion
Our data clearly reveals the need for standardization in microbiome analyses. Here, we demonstrate that bacterial identification and the evaluation of relative abundances in mixed samples can be affected by the 16S rRNA region chosen for amplification, general inter-laboratory differences, and variations between data analysis platforms. ATCC NGS Standards combined with the One Codex data analysis module provide a comprehensive solution for standardizing data from a wide range of sources, and generating consensus among microbiome applications and analyses.
Download a PDF of this application note
Download NowReferences
- Wesolowska-Andersen A, et al. Choice of bacterial DNA extraction method from fecal material influences community structure as evaluated by metagenomic analysis. Microbiome 2: 19, 2014.
- Brooks JP, et al. The truth about metagenomics: quantifying and counteracting bias in 16S rRNA studies. BMC Microbiol 15: 66, 2015.
- Yuan S, Cohen DB, Ravel J, Abdo Z, Forney L J. Evaluation of methods for the extraction and purification of DNA from the human microbiome. PLoS One 7: e33865, 2012.
- Wagner Mackenzie B, Waite D, Taylor M. Evaluating variation in human gut microbiota profiles due to DNA extraction method and intersubject differences. Front Microbiol 6:130, 2015.
- Office of Cyber Infrastructure and Computational Biology (OCICB), National Institute of Allergy and Infectious Diseases (NIAID). Nephele. http://nephele.niaid.nih.gov, 2016.
- Huang W, Li L, Myers JR, Marth GT. ART: a next-generation sequencing read simulator. Bioinformatics 28(4): 593-594, 2012.
Acknowledgments
We would like to thank Dr. Stefan J. Green, Director, DNA Services Facility, University of Illinois at Chicago, for the generation of sequencing data and for his valuable input.
About One Codex
One Codex is the leading bioinformatics platform for microbial genomics, supporting taxonomic and functional analysis of metagenomic (WGS), 16S, and other sequencing data. We specialize in creating robust, scalable, and secure bioinformatics solutions for metagenomics and microbial genomics, with a strong focus on ease of use. Founded in 2014, the One Codex platform counts thousands of users across leading academic institutions, biotechnology companies, and public sector organizations. One Codex is built on top of Amazon Web Services and is the only microbial genomics offering providing HIPAA-level security, as well as other strong compliance and audit guarantees. To learn more, visit http://www.onecodex.com.